Prometheus는 쿠버네티스 환경에서 인기 있는 오픈소스 모니터링 도구이다.
하지만 몇 가지 치명적인 단점이 있다.
- 확장 및 고가용성의 한계
Prometheus는 단일 서버로 동작하게 설계되어 있다. 즉, 서버가 내려가면 그 시간 동안 메트릭을 수집할 수 없게 됨을 의미한다. 이를 보완하기 위해 프로메테우스 서버를 2개로 하여 모니터링을 하면 하나의 서버가 내려가더라도 다른 하나의 서버로 메트릭을 볼 수 있지만, 여전히 근본적인 해결이 안된 불완전한 아키텍처로 샤딩, Prometheus Federation 구성 등의 추가 작업이 필요하다. - 오래된 데이터 보관의 어려움
Prometheus는 메트릭을 로컬 디스크에 수집하여 보관하는데, 저장소의 용량이 한계에 도달하면 오래된 데이터가 자동으로 삭제되어 일정 시간이 지난 데이터는 조회할 수 없게 된다.
이러한 단점을 보완해 주는 솔루션 중 하나가 Thanos이다.
참고
Grafama Mimir도 Thanos와 유사한 솔루션 중 하나로 2022년 Grafana Labs에서 개발한 오픈소스 프로젝트이다. Mimir는 Prometheus와 호환되며, 멀티 테넌시, 수평 확장, 장기 스토리지 지원 등 대규모 환경에 적합한 기능들을 제공한다.
참고 링크: Grafana Mimir란? 개념부터 설치까지
Thanos는 여러 프로메테우스 서버의 사이드카를 통해 데이터를 수집하고 중앙 집중화된 view를 제공하면서 aws s3와 같은 object storage를 이용하여 오래된 데이터 보존 문제를 해결한다. 또한 중복된 label을 제거하는 중복 제거(Deduplication) 기능이 있다.
현재 Thanos는 CNCF의 incubating 프로젝트로 활발한 커뮤니티와 함께 꾸준히 발전하고 있는 오픈소스 솔루션이다.
Thanos의 아키텍처는 다음과 같다.

주요 컴포넌트에 대한 설명은 다음과 같다.
- Sidecar : Prometheus에 사이드카 패턴으로 생성되어 최근 메트릭 query를 처리하기 위해 Store API 컴포넌트에 의해 데이터를 읽고, Shipper 컴포넌트에 의해 Object 스토리지 버킷에 업로드한다.
- Query : 분산 쿼리 엔진으로 쿼리를 실행하고 결과를 반환하며, 중복 제거(Deduplication)를 수행한다.
- query-frontend : Thanos query의 read path를 개선하기 위한 프론트 엔드 서비스이다. 병렬화 처리, 캐싱을 통해 쿼리 성능 향상을 돕는다.
- Compactor : 쿼리 성능과 저장소 사용량을 최적화하기 위한 데이터 압축, 다운샘플링 및 보관주기를 관리한다.
- Store Gateway : Prometheus 서버와 객체 스토리지 간의 중개자라고 볼 수 있다. Thanos 클러스터에서 query 할 수 있는 데이터를 object storage bucket에서 읽어 들여 Thanos Store API를 제공해 주는 역할을 수행한다.
- Ruler : Alertmanager와 Prometheus의 룰을 조합하여 Thanos 시스템에 대한 알림 규칙을 생성하고 관리한다.
본 글에서는 첫 번째 Prometheus-1이 설치되어 있는 EKS 클러스터에 Thanos를 설치할 것이다.
실습 구성을 간단히 표현하면 아래와 같다.

실습
전제 조건
- [Prometheus + Grafana 설치]
- Kubernetes 클러스터
- AWS S3 Bucket
설치 버전
- EKS 1.22.17
- thanos helm chart : 12.5.1 / app : 0.63.0
- prometheus helm chart : 45.20.0 / app : 0.31.0
1. Prometheus-1 설정
아래와 같이 objstore.yml파일을 만든다.
## objstore.yml
type: S3
config:
  bucket: "thanos-s3-test"
  endpoint: "s3.ap-northeast-2.amazonaws.com"
  region: "ap-northeast-2"
  access_key: "{aws access_key}"
  secret_key: "{aws secret_key}"
  trace:
    enable: true
위 파일을 사용하여 시크릿을 생성한다.
$ kubectl create secret generic s3-secret --from-file=objstore.yml -n monitoring
아래와 같이 prometheus-thanos.yaml 파일을 생성한다.
## prometheus-thanos-values.yaml
prometheus:
  thanosService:
    enabled: true
  prometheusSpec:
    externalLabels:
      cluster: prometheus-1    ## 클러스터 구분을 위한 labels 설정
    thanos:
      objectStorageConfig:
        key: objstore.yml
        name: s3-secret
      version: v0.31.0
prometheus helm 업그레이드로 변경사항을 적용한다.
$ helm upgrade -i -n monitoring -f prometheus-values.yaml -f prometheus-thanos-values.yaml prometheus \
--set fullnameOverride=prometheus \
--set prometheus-community/kube-prometheus-stack --atomic
업그레이드 완료 후 prometheus-0 pod를 조회해 보면 thanos-sidecar 컨테이너가 추가된 것을 확인할 수 있다.
$ kubectl get po -n monitoring prometheus-prometheus-prometheus-0 -o=jsonpath='{.spec.containers[*].name}' | tr ' ' '\n'
prometheus
config-reloader
thanos-sidecar   ## 추가 사이드카 컨테이너
Thanos 사이드카 엔드포인트를 위한 service도 생성된 것을 확인할 수 있다.
$ kubectl get svc -n monitoring
NAME                                  TYPE        CLUSTER-IP       EXTERNAL-IP   PORT(S)                      AGE
#...
prometheus-thanos-discovery           ClusterIP   None             <none>        10901/TCP,10902/TCP          27m
2. Prometheus-2 설정
두 번째 클러스터의 Prometheus도 위와 동일하게 설치하고, 클러스터 구분을 위해 externalLabels만 prometheus-2로 설정한다.
## prometheus-thanos-values.yaml
prometheus:
  prometheusSpec:
    externalLabels:
      cluster: prometheus-2    ## 클러스터 구분을 위한 labels 설정
prometheus-2 thanos 사이드카 노출
- cluster1에 Thanos를 설치할 거 기 때문에 cluster2에 Thanos 사이드카를 노출해야 한다. Loadbalancer type으로 service를 만들어 Thanos에서 접근할 수 있게 한다.
$ kubectl apply -f - <<EOF
apiVersion: v1
kind: Service
metadata:
  annotations:
    meta.helm.sh/release-name: prometheus
    meta.helm.sh/release-namespace: monitoring
  labels:
    app: kube-prometheus-stack-thanos-discovery
    app.kubernetes.io/instance: prometheus
    app.kubernetes.io/managed-by: Helm
    app.kubernetes.io/part-of: kube-prometheus-stack
    app.kubernetes.io/version: 45.21.0
    chart: kube-prometheus-stack-45.21.0
    heritage: Helm
    release: prometheus
  name: prometheus-thanos-discovery-export
  namespace: monitoring
spec:
  ports:
  - name: grpc
    port: 10901
    protocol: TCP
    targetPort: grpc
  - name: http
    port: 10902
    protocol: TCP
    targetPort: http
  selector:
    app.kubernetes.io/name: prometheus
    prometheus: prometheus-prometheus
  type: LoadBalancer
EOF
3. Thanos 구성
Thanos Helm 차트 등록 (bitnami)
$ helm repo add bitnami https://charts.bitnami.com/bitnami
아래와 같이 thanos-vaules.yaml 파일을 작성한다.
## thanos-vaules.yaml
global:
  storageClass: gp2
existingObjstoreSecret: s3-secret
query:
  enabled: true
  stores:
  - prometheus-thanos-discovery:10901
  - {cluster-2 prometheus-thanos-discovery-export loadbalancer ip}:10901  ## cluster2 prometheus에서 생성한 prometheus-thanos-discovery-export ip
queryFrontend:
  enabled: true
  config: |-
    type: IN-MEMORY
    config:
      max_size: 512MB
      max_size_items: 100
      validity: 120s
  extraFlags:
  - --query-range.split-interval=24h
  - --query-range.max-retries-per-request=5
  - --query-frontend.log-queries-longer-than=60s
  service:
    type: LoadBalancer
bucketweb:
  enabled: false
compactor:
  enabled: true
  retentionResolutionRaw: 30d
  retentionResolution5m: 30d
  retentionResolution1h: 1y
  consistencyDelay: 30m
storegateway:
  enabled: true
  config: |-
    type: IN-MEMORY
    config:
      max_size: 300MB
      max_item_size: 120MB
ruler:
  enabled: true
  evalInterval: 1m
  config: |-
    groups:
      - name: "monitoring"
        rules:
          - alert: "PrometheusDown"
            expr: absent(up{prometheus="monitoring/prometheus-prometheus"})
  alertmanagers:
    - http://prometheus-alertmanager:9093
receive:
  enabled: false
위 설정에 대한 설명은 아래와 같다.
- query-frontend
IN-MEMORY 방식을 사용하며, 최대 512MB의 데이터와 최대 100개의 데이터를 유지하며, 유효 시간은 120초이다. 추가적으로 데이터를 처리할 때 24시간 간격으로 분할하며, 데이터 요청에 최대 5번까지 재시도한다. 마지막으로, 실행 시간이 60초 이상인 쿼리는 로그에 기록된다. - compactor
raw, 5분, 1시간 단위로 다운샘플링된 데이터의 보존기간이다. (40시간 지난 raw 데이터를 5m 해상도로, 10일 지난 5m 데이터를 1h 해상도로 다운샘플링 된다.)
consistencyDelay 값을 통해 s3 저장소에 업로드된 후 지정한 시간 후에 블록을 읽을 수 있다. 이는 부분적 업로드된 블록을 읽거나 처리하는 경우를 방지하여 일관성을 유지할 수 있다. - storegateway : 최대 300MB의 메모리를 사용하며, 처리할 수 있는 최대 블록 크기는 120MB이다.
위에서 생성한 파일로 Thanos 설치
$ helm upgrade -i thanos bitnami/thanos -n monitoring -f thanos-vaules.yaml
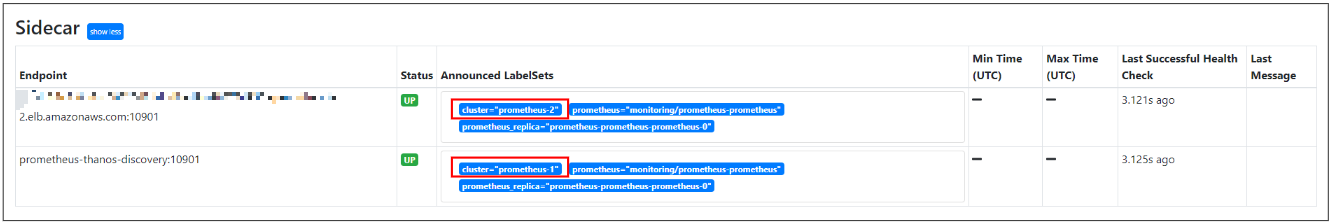
thanos-query-frontend서비스에 접근하여 Thanos Stores 대시보드 확인하면 아래와 같이 두 개의 prometheus 정보를 확인할 수 있다.
grafana 대시보드에서 prometheus-1, prometheus-2 label로 구분하여 출력하면 다음과 같이 메트릭을 볼 수 있다.

s3 버킷을 확인해 보면 데이터가 잘 쌓이는 걸 확인할 수 있다.


4. Prometheus HA 구성 및 중복제거
4-1. Prometheus 중복제거 확인
prometheus-values.yaml 파일에서 prometheus replicas를 늘린다
## prometheus-values.yaml
prometheus:
  prometheusSpec:
    replicas: 3
prometheus helm 차트 업그레이드로 변경된 내용을 적용한다.
$ helm upgrade -i prometheus -f prometheus-values.yaml prometheus-community/kube-prometheus-stack \
--namespace monitoring \
--set fullnameOverride=prometheus
prometheus-0 파드의 subdomain 정보를 확인한다.
$ kubectl get po -n monitoring prometheus-prometheus-prometheus-0 -oyaml | grep subdomain
  subdomain: prometheus-operated
Thanos-values.yaml 파일에서 headless 서비스에 연결되어 있는 Pod를 지정하기 위해 {pod-name}.{subdomain}:10901 형태로 지정한다.
## thanos-vaules.yaml
query:
  enabled: true
  stores:
  - prometheus-prometheus-prometheus-0.prometheus-operated:10901
  - prometheus-prometheus-prometheus-1.prometheus-operated:10901
  - prometheus-prometheus-prometheus-2.prometheus-operated:10901
  - {cluster-2 prometheus-thanos-discovery-export loadbalancer ip}:10901
  replicaLabel: [prometheus_replica]
Thanos Helm 차트 upgrade를 통해 변경사항 적용한다.
$ helm upgrade -i thanos bitnami/thanos -n monitoring -f thanos-vaules.yaml
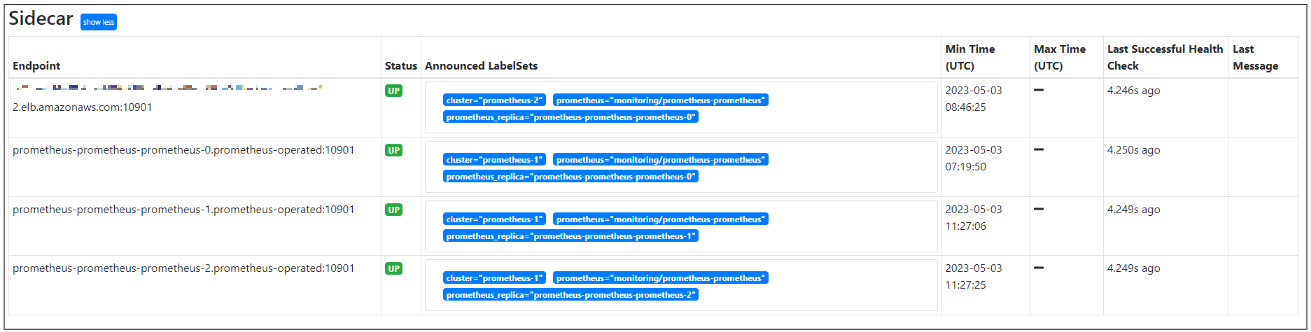
Thanos 사이드카 엔드포인트 증가된 걸 확인할 수 있다.
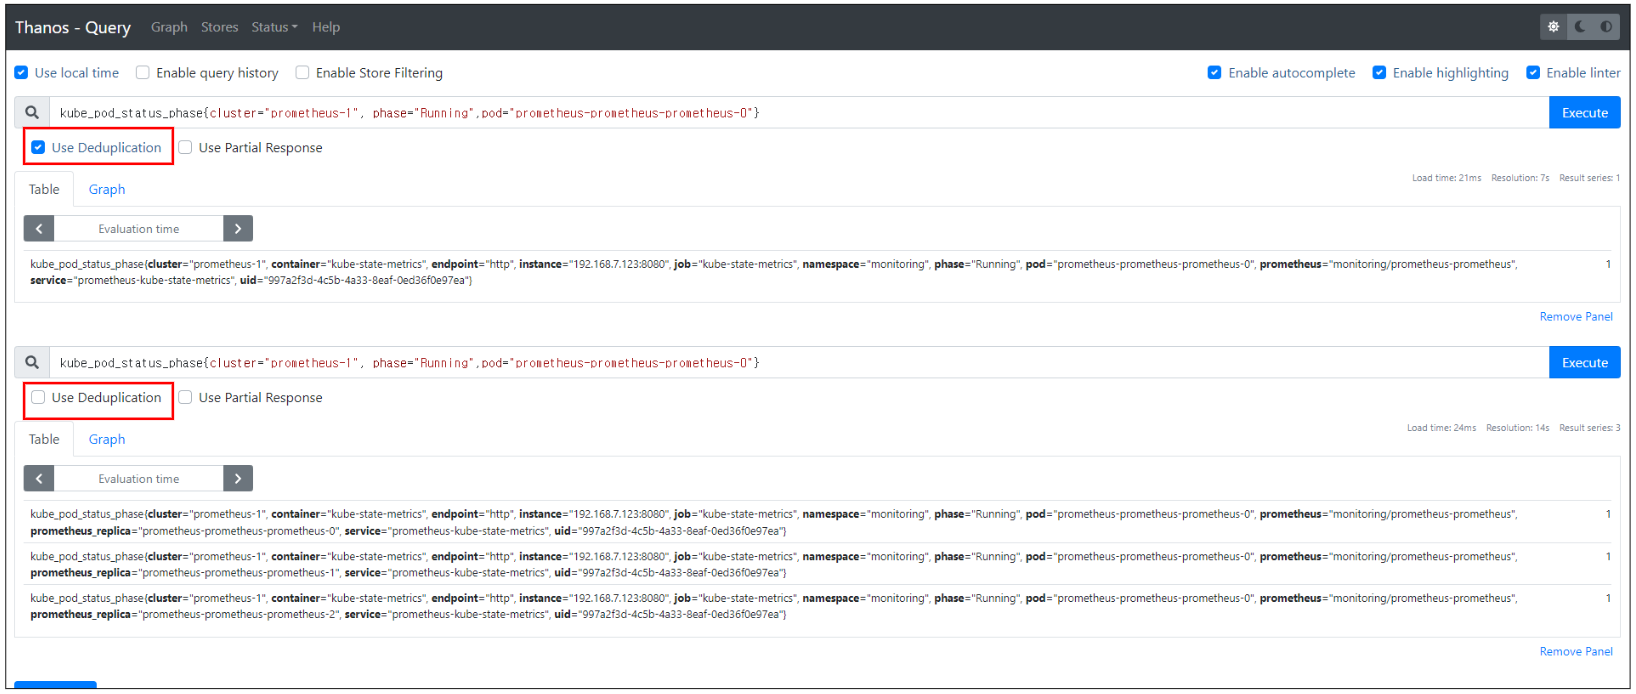
"Use Deduplication"를 체크하면 중복된 결과가 제거되는 것을 확인할 수 있다.
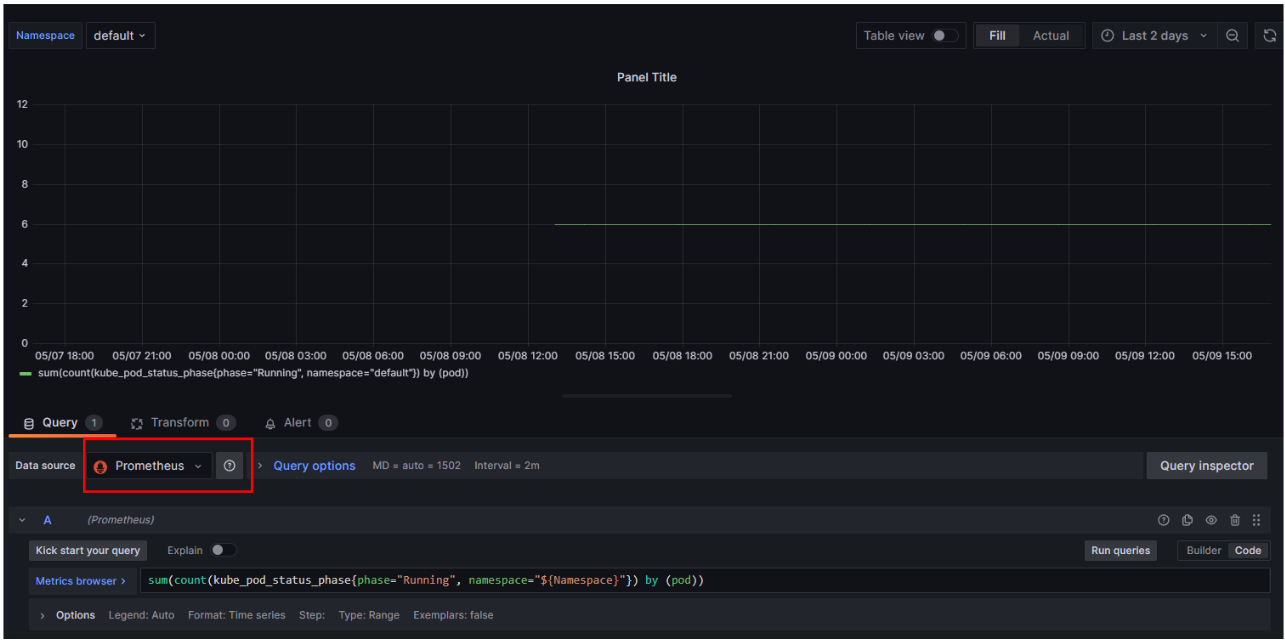
(기본 중복제거가 활성화되어 있기에 Grafana를 통해 확인하면 중복 제거된 결과를 확인할 수 있다.
중복제거 확인을 했으면 thanos-values.yaml 파일을 원래 값으로 원복하고 Helm upgrade로 적용한다.
## thanos-values.yaml
query:
  enabled: true
  stores:
  - prometheus-thanos-discovery:10901
  - {cluster-2 prometheus-thanos-discovery-export loadbalancer ip}:10901
4.2 Prometheus HA 동작 테스트
prometheus-thanos-discovery:10901로 원복 하면 다음과 같이 Sidecar Endpoint가 한 개가 된 걸 확인할 수 있다.

잘 보면 prometheus-thanos-discovery 서비스의 엔드포인트의 pod는 총 3개의 Prometheus 파드이다.
$ kubectl describe  ep -n monitoring  prometheus-thanos-discovery
Name:         prometheus-thanos-discovery
Namespace:    monitoring
##...
Subsets:
  Addresses:          192.168.6.250,192.168.7.93,192.168.8.72

$ kubectl get po -o wide -n monitoring | grep prometheus-prometheus-prometheus-
prometheus-prometheus-prometheus-0               3/3     Running   0              15h    192.168.6.250
prometheus-prometheus-prometheus-1               3/3     Running   0              15h    192.168.8.72
prometheus-prometheus-prometheus-2               3/3     Running   0              15h    192.168.7.93
즉, 현재는 prometheus-prometheus-prometheus-1 파드를 바라보고 있는데, prometheus-prometheus-prometheus-1 파드가 내려간다면 다른 Pod를 볼 것이다.
prometheus-prometheus-prometheus-1 파드를 delete 하고 상태를 확인해 보면 prometheus-prometheus-prometheus-0 파드 엔드포인트 정보로 변경된 것을 확인할 수 있다.
$ kubectl delete po -n monitoring prometheus-prometheus-prometheus-1
pod "prometheus-prometheus-prometheus-1" deleted
위처럼 여러 Prometheus 파드 중 하나의 파드 엔드포인트 정보를 가져오는 방식으로 HA가 동작하게 된다.
5. Prometheus, Thanos 데이터 보관주기 비교
prometheus는 보관주기를 1d로 설정하고 비교해 보았다.
Prometheus data source를 사용하여 확인해 보면 24시간 전까지의 데이터만 읽어오는 걸 확인할 수 있다.
반면 Thanos Data source를 사용하면 그 이상의 데이터를 가져오는 걸 확인할 수 있다.
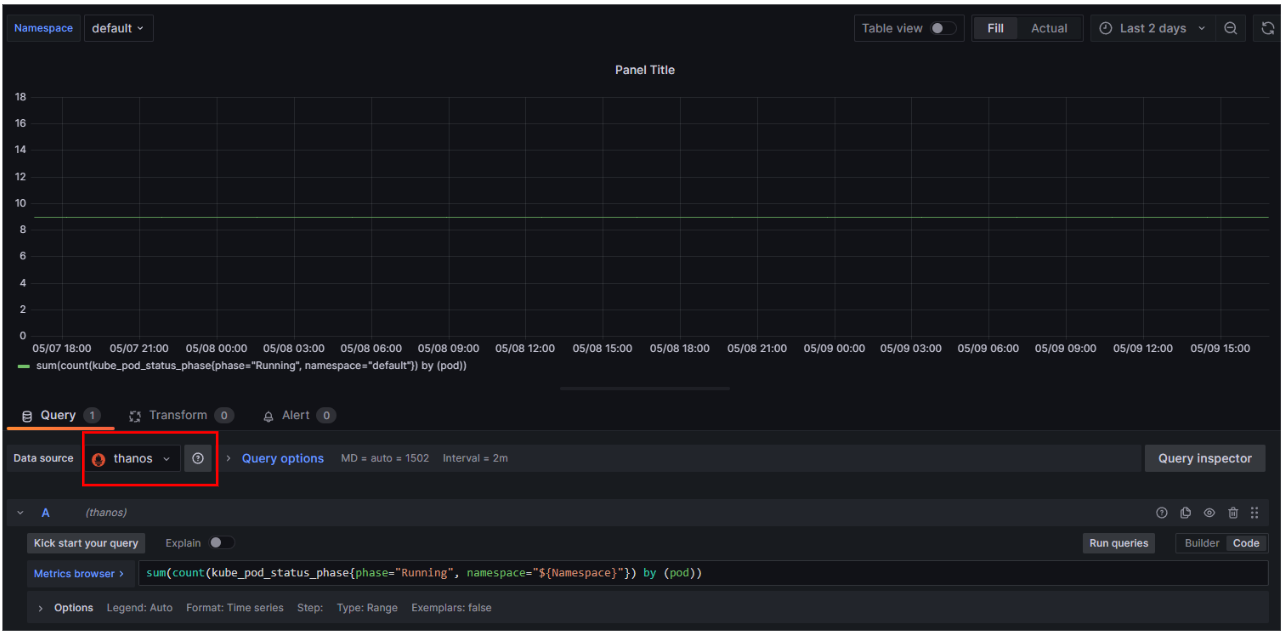
이는 1일 데이터는 Thanos sidecar를 이용하여 prometheus 서버의 local data에서 가져오고, 이후 데이터는 Thanos의 Store Gateway를 통해 s3에서 데이터를 가져오는 것이다.
'Observability > Prometheus & Grafana' 카테고리의 다른 글
| [Prometheus] HA 구성 2 (With 샤딩 + Thanos) (3) | 2023.05.10 |
|---|---|
| [Prometheus] 란? (0) | 2023.05.10 |
| [Grafana] + AWS CloudWatch를 이용한 AWS 모니터링 (0) | 2023.05.09 |
| [Grafana] 대시보드 Variables 활용하기 (0) | 2023.05.04 |
| [Prometheus] + Grafana 초간단 설치 (0) | 2023.04.29 |


댓글