Grafana loki를 사용하면 일반적으로 로그 수집기는 같은 Grafana Labs 프로젝트에 포함되어 있는 Promtail을 사용하여 구성한다.(구성 참고:[Grafana Loki란? 개념부터 설치까지])
본 글에서는 로그 수집기로 Opentelemetry collector를 사용하여 구성하는 실습을 다룬다.
실습 구성은 아래와 같다.

- Opentelemetry collector의 filelog Recivers가 노드에 있는 Pod의 로그 파일을 읽어 파싱 한다.
- Opentelemetry collector의 Processors로 body에 있는 로그 내용을 fields로 변환한다.
- Opentelemetry collector의 loki Exporters가 로그 데이터를 Grafana loki로 보낸다.
- Grafana loki는 받은 로그 데이터를 S3에 저장한다.
- Grafana에서 data source로 Grafana loki를 등록하여 저장된 로그 데이터를 쿼리 한다.
실습
전제 조건
- [Grafana 구성]
- [Grafana loki 구성]
- AWS S3 버킷 생성
- AWS EKS 클러스터
- Helm CLI
구성 환경
- AWS EKS : v1.24.17
- Helm : v3.8.2
설치 버전
- Opentelemetry-collector: 0.81.0
- Grafana Loki : 2.9.1
- Grafana : 10.1.4
1. Opentelemetry 구성
Opentelemetry-collector Helm chart values 파일을 아래와 같이 작성한다. (otel-values.yaml)
## otel-values.yaml
mode: daemonset

clusterRole:
  create: true
  rules:
  - apiGroups:
    - ""
    resources:
    - pods
    - namespaces
    - nodes
    - nodes/proxy
    - services
    - endpoints
    verbs:
    - get
    - watch
    - list
  - apiGroups:
    - extensions
    resources:
    - ingresses
    verbs:
    - get
    - list
    - watch
  - nonResourceURLs:
    - /metrics
    verbs:
    - get

config:
  exporters:
    loki:
      endpoint: http://loki-loki-distributed-gateway.logging/loki/api/v1/push
  receivers:
    jaeger: null
    filelog:
      include: [ /var/log/pods/*/*/*.log ]
      start_at: beginning
      include_file_path: true
      include_file_name: false
      retry_on_failure:
        enabled: true
      operators:
        - type: router
          id: get-format
          routes:
            - output: parser-containerd
              expr: 'body matches "^[^ Z]+Z"'
        - type: regex_parser
          id: parser-containerd
          regex: '^(?P<time>[^ ^Z]+Z) (?P<stream>stdout|stderr) (?P<logtag>[^ ]*) ?(?P<log>.*)$'
          output: extract_metadata_from_filepath
          timestamp:
            parse_from: attributes.time
            layout: '%Y-%m-%dT%H:%M:%S.%LZ'
        - type: regex_parser
          id: extract_metadata_from_filepath
          regex: '^.*\/(?P<namespace>[^_]+)_(?P<pod_name>[^_]+)_(?P<uid>[a-f0-9\-]{36})\/(?P<container_name>[^\._]+)\/(?P<restart_count>\d+)\.log$'
          parse_from: attributes["log.file.path"]
          cache:
            size: 128
        - type: move
          from: attributes.stream
          to: attributes["log.iostream"]
        - type: move
          from: attributes.container_name
          to: resource["k8s.container.name"]
        - type: move
          from: attributes.namespace
          to: resource["k8s.namespace.name"]
        - type: move
          from: attributes.pod_name
          to: resource["k8s.pod.name"]
        - type: move
          from: attributes.restart_count
          to: resource["k8s.container.restart_count"]
        - type: move
          from: attributes.uid
          to: resource["k8s.pod.uid"]
        - type: remove
          field: attributes.time
        - type: move
          from: attributes.log
          to: body

  processors:
    attributes:
      actions:
        - action: insert
          key: loki.attribute.labels
          value: log.file.path, log.iostream, time, logtag
    resource:
      attributes:
      - action: insert
        key: loki.resource.labels
        value: k8s.pod.name, k8s.node.name, k8s.namespace.name, k8s.container.name, k8s.container.restart_count, k8s.pod.uid

  service:
    extensions:
      - health_check
      - memory_ballast
    pipelines:
      logs:
        exporters:
        - loki
        processors:
        - batch
        - resource
        - attributes
        receivers:
        - filelog
      traces: null
presets:
  logsCollection:
    enabled: true
includeCollectorLogs: true- config.receivers.include_file_path
- Pod의 파일 이름 기반으로 namespace, pod_name, container_name 등을 추출하기 위해 활성화한다.
- presets.logsCollection.enabled
- opentelemetry-collector pod가 노드의 pod 로그 파일을 읽으려면 hostPath로 pod 로그 파일을 마운트 해야 한다. true로 하면 해당 위치를 마운트 한다.

- opentelemetry-collector pod가 노드의 pod 로그 파일을 읽으려면 hostPath로 pod 로그 파일을 마운트 해야 한다. true로 하면 해당 위치를 마운트 한다.
- presets.logsCollection.includeCollectorLogs
- true로 하면 opentelemetry-collector pod의 로그를 수집한다.
(opentelemetry-helm-charts/charts/opentelemetry-collector/templates/_config.tpl)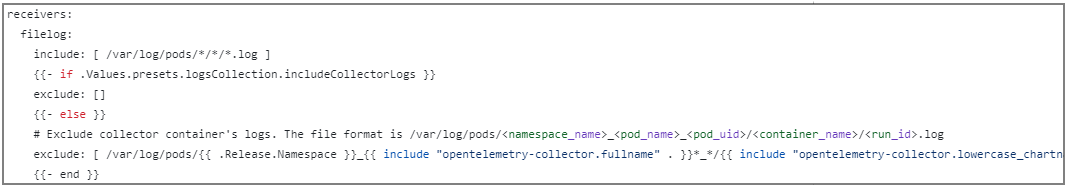
- true로 하면 opentelemetry-collector pod의 로그를 수집한다.
Opentelemetry Helm chart를 등록한다.
$ helm repo add open-telemetry https://open-telemetry.github.io/opentelemetry-helm-charts
$ helm repo update
위에서 작성한 values 파일로 설치한다.
$ helm upgrade --install opentelemetry-collector open-telemetry/opentelemetry-collector --namespace opentelemetry -f otel-values.yaml
2. Grafana에서 로그 쿼리
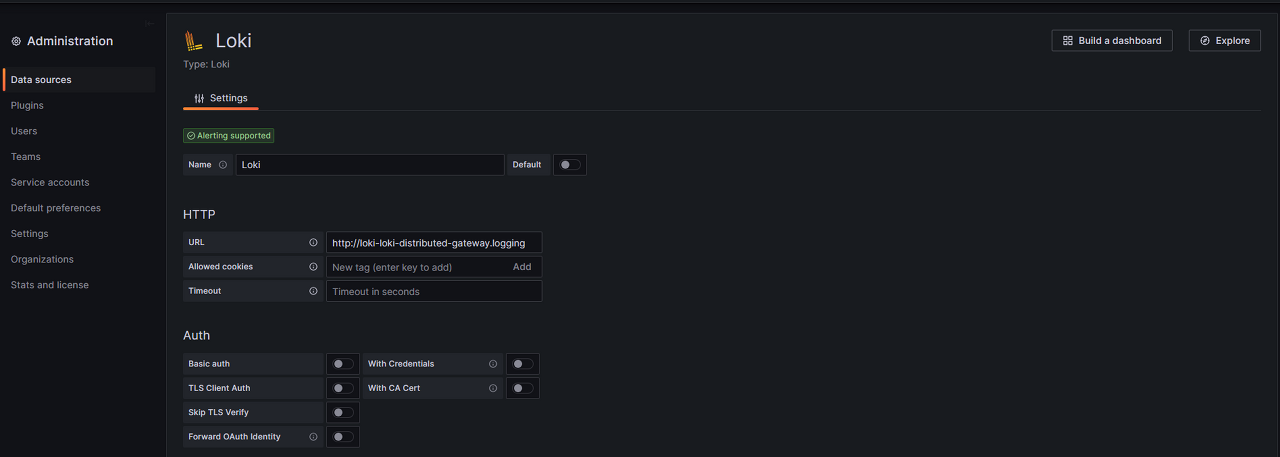
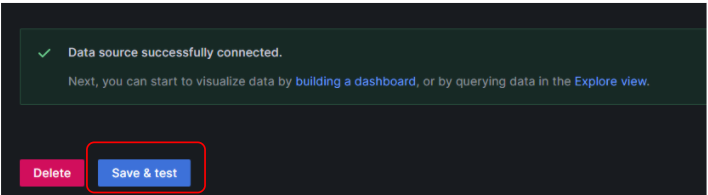
Grafana 대시보드로 들어가 Loki를 data sources로 등록한다.
- Home > Administration > Data sources
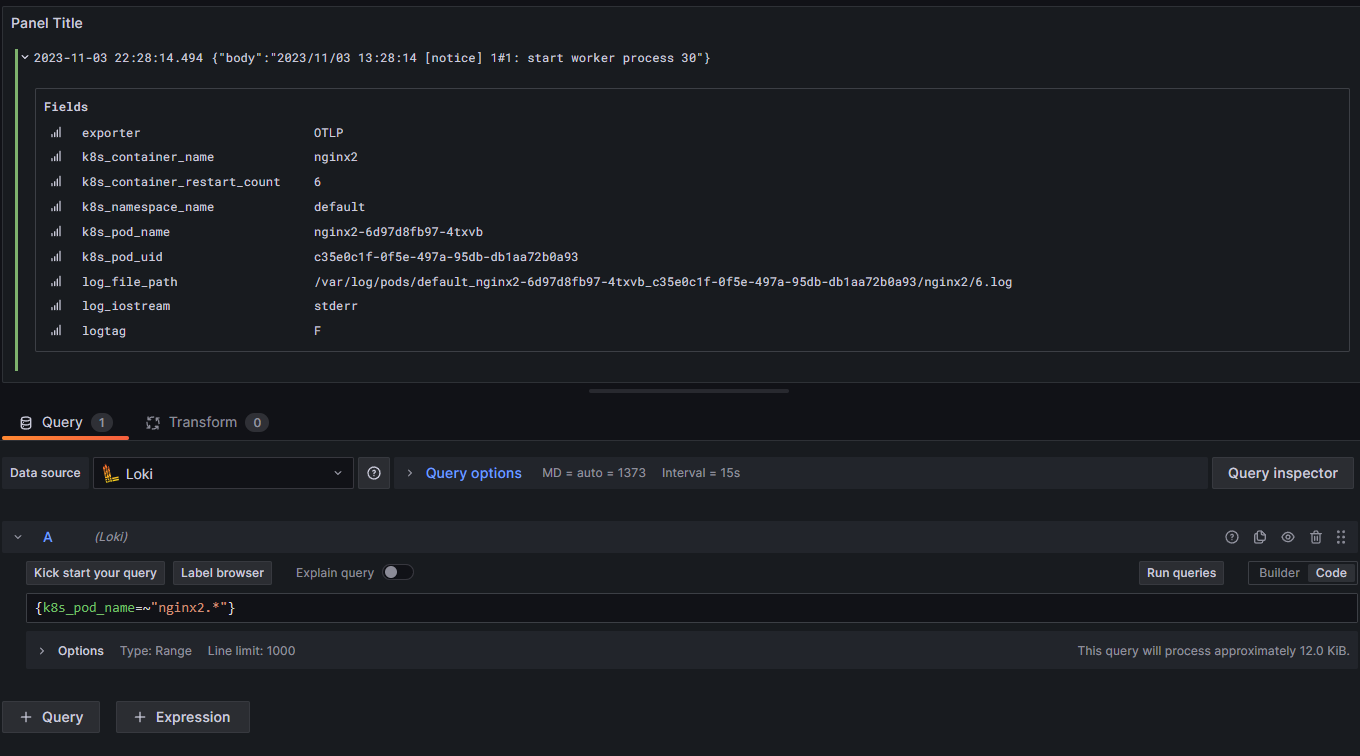
"Home > Dashboards > New dashboard"로 들어가 data source를 위에서 생성한 Loki로 지정하고 아래와 같이 쿼리 하여 로그를 조회한다. k8s_pod_name이라는 필드 기반으로 로그를 조회하였다.
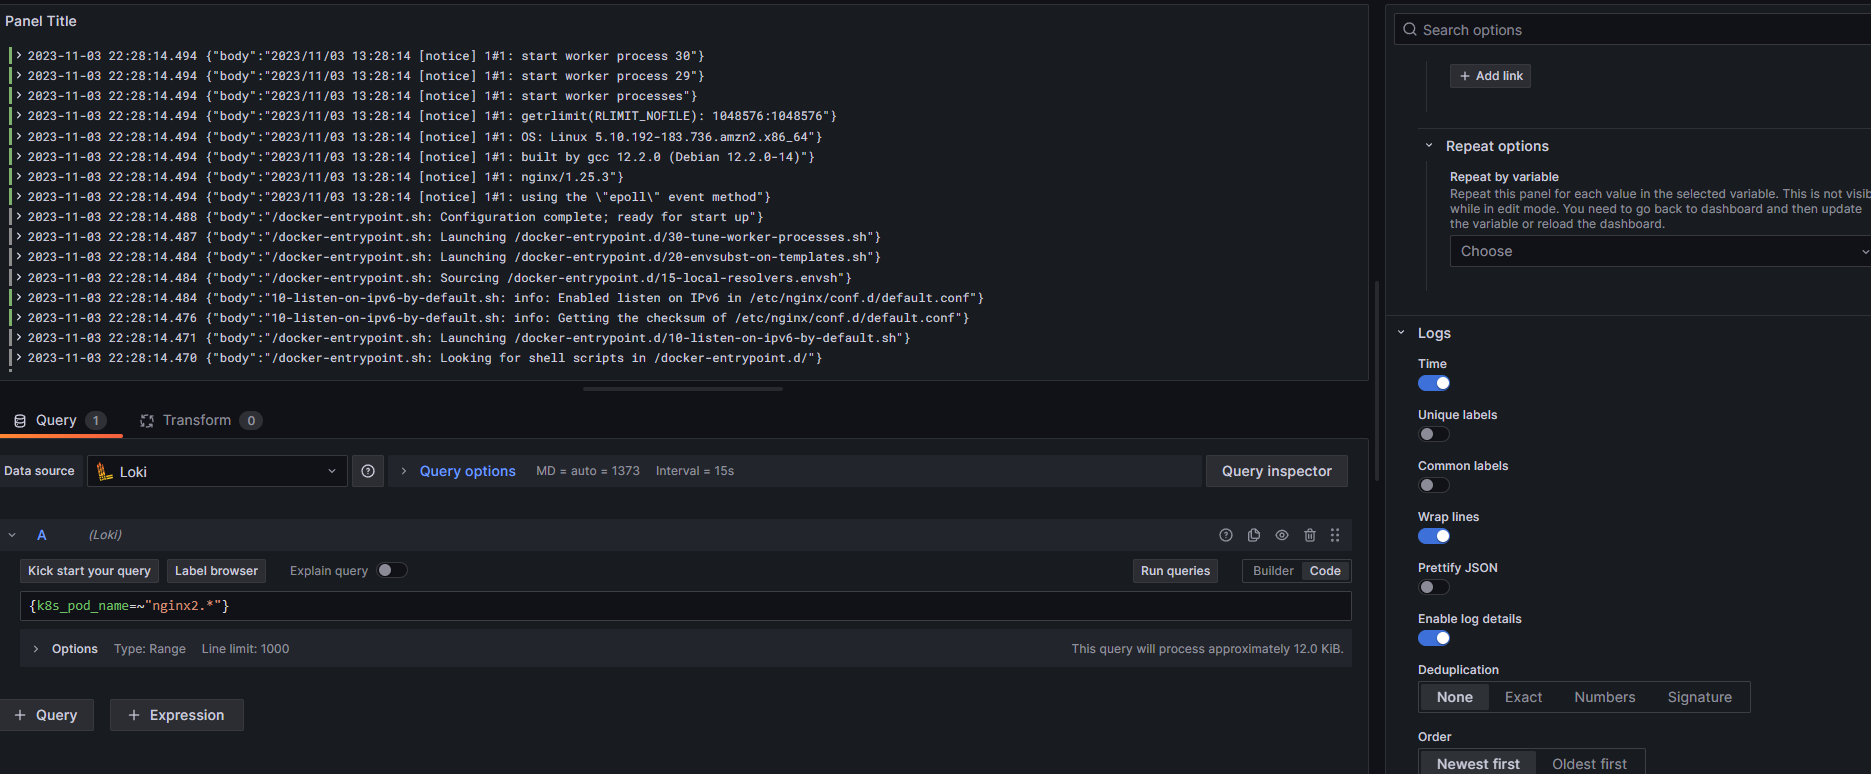
아래 보이는 Fields는 opentelemetry-collecor helm chart의 processors에서 설정한 내용으로 구분되어 보이는 것이다.
3. 고려할 점
Grafana loki는 Opentelmetry-collector에서 받은 chunk를 S3 또는 filesystem으로 보관하기 위해 업로드할 때 Opentelemetry-collector에서 내보낸 labels을 기반으로 chunk파일을 업로드한다.
아래는 Grafana loki의 ingester가 chunk를 S3로 업로드할 때 발생하는 로그 내용이다.
##... ingester pod log
caller=flush.go:167 msg="flushing stream" user=fake fp=ede7b6a0e7161fec immediate=false num_chunks=1 labels="{exporter=\"OTLP\", k8s_container_name=\"kube-proxy\", k8s_container_restart_count=\"6\", k8s_namespace_name=\"kube-system\", k8s_pod_name=\"kube-proxy-9nxmt\", k8s_pod_uid=\"86fbc102-b233-4636-9767-2c3b288691b8\", log_file_path=\"/var/log/pods/kube-system_kube-proxy-9nxmt_86fbc102-b233-4636-9767-2c3b288691b8/kube-proxy/6.log\", logtag=\"F\", stream=\"stderr\", time=\"2023-11-03T06:16:18.701484208Z\"}"
caller=flush.go:167 msg="flushing stream" user=fake fp=b42a6f5d84f631b0 immediate=false num_chunks=1 labels="{exporter=\"OTLP\", k8s_container_name=\"kube-proxy\", k8s_container_restart_count=\"3\", k8s_namespace_name=\"kube-system\", k8s_pod_name=\"kube-proxy-dzn8q\", k8s_pod_uid=\"7bd7437a-3a8a-457b-a6fc-f0ae1ca01b64\", log_file_path=\"/var/log/pods/kube-system_kube-proxy-dzn8q_7bd7437a-3a8a-457b-a6fc-f0ae1ca01b64/kube-proxy/3.log\", logtag=\"F\", stream=\"stderr\", time=\"2023-11-03T06:16:19.690678203Z\"}"
caller=flush.go:167 msg="flushing stream" user=fake fp=ba9416217e2640d5 immediate=false num_chunks=1 labels="{exporter=\"OTLP\", k8s_container_name=\"kube-proxy\", k8s_container_restart_count=\"0\", k8s_namespace_name=\"kube-system\", k8s_pod_name=\"kube-proxy-lppmc\", k8s_pod_uid=\"6f961951-d99a-4bde-8549-d852782bc8fa\", log_file_path=\"/var/log/pods/kube-system_kube-proxy-lppmc_6f961951-d99a-4bde-8549-d852782bc8fa/kube-proxy/0.log\", logtag=\"F\", stream=\"stderr\", time=\"2023-11-03T06:16:18.651528496Z\"}"
caller=flush.go:167 msg="flushing stream" user=fake fp=bfa2f1a5f3efa1c5 immediate=false num_chunks=1 labels="{exporter=\"OTLP\", k8s_container_name=\"kube-proxy\", k8s_container_restart_count=\"3\", k8s_namespace_name=\"kube-system\", k8s_pod_name=\"kube-proxy-dzn8q\", k8s_pod_uid=\"7bd7437a-3a8a-457b-a6fc-f0ae1ca01b64\", log_file_path=\"/var/log/pods/kube-system_kube-proxy-dzn8q_7bd7437a-3a8a-457b-a6fc-f0ae1ca01b64/kube-proxy/3.log\", logtag=\"F\", stream=\"stderr\", time=\"2023-11-03T06:16:18.651401306Z\"}"
caller=flush.go:167 msg="flushing stream" user=fake fp=f7ee3d1653043556 immediate=false num_chunks=1 labels="{exporter=\"OTLP\", k8s_container_name=\"kube-proxy\", k8s_container_restart_count=\"0\", k8s_namespace_name=\"kube-system\", k8s_pod_name=\"kube-proxy-lppmc\", k8s_pod_uid=\"6f961951-d99a-4bde-8549-d852782bc8fa\", log_file_path=\"/var/log/pods/kube-system_kube-proxy-lppmc_6f961951-d99a-4bde-8549-d852782bc8fa/kube-proxy/0.log\", logtag=\"F\", stream=\"stderr\", time=\"2023-11-03T06:16:18.662238046Z\"}"
caller=flush.go:167 msg="flushing stream" user=fake fp=41b5f159defd79de immediate=false num_chunks=1 labels="{exporter=\"OTLP\", k8s_container_name=\"kube-proxy\", k8s_container_restart_count=\"6\", k8s_namespace_name=\"kube-system\", k8s_pod_name=\"kube-proxy-9nxmt\", k8s_pod_uid=\"86fbc102-b233-4636-9767-2c3b288691b8\", log_file_path=\"/var/log/pods/kube-system_kube-proxy-9nxmt_86fbc102-b233-4636-9767-2c3b288691b8/kube-proxy/6.log\", logtag=\"F\", stream=\"stderr\", time=\"2023-11-03T06:16:18.63490227Z\"}"
caller=flush.go:167 msg="flushing stream" user=fake fp=f77b573b7015b46d immediate=false num_chunks=1 labels="{exporter=\"OTLP\", k8s_container_name=\"kube-proxy\", k8s_container_restart_count=\"3\", k8s_namespace_name=\"kube-system\", k8s_pod_name=\"kube-proxy-dzn8q\", k8s_pod_uid=\"7bd7437a-3a8a-457b-a6fc-f0ae1ca01b64\", log_file_path=\"/var/log/pods/kube-system_kube-proxy-dzn8q_7bd7437a-3a8a-457b-a6fc-f0ae1ca01b64/kube-proxy/3.log\", logtag=\"F\", stream=\"stderr\", time=\"2023-11-03T06:16:18.662629894Z\"}"
caller=flush.go:167 msg="flushing stream" user=fake fp=8da515839c083c1c immediate=false num_chunks=1 labels="{exporter=\"OTLP\", k8s_container_name=\"kube-proxy\", k8s_container_restart_count=\"6\", k8s_namespace_name=\"kube-system\", k8s_pod_name=\"kube-proxy-9nxmt\", k8s_pod_uid=\"86fbc102-b233-4636-9767-2c3b288691b8\", log_file_path=\"/var/log/pods/kube-system_kube-proxy-9nxmt_86fbc102-b233-4636-9767-2c3b288691b8/kube-proxy/6.log\", logtag=\"F\", stream=\"stderr\", time=\"2023-11-03T06:16:18.670045289Z\"}"
...
labels 부분을 보면 Opentelemetry-collector에서 파싱 하여 생성된 labels이다. 위 labels에서 time을 보면 pod 로그 내용 중 time에서 파싱 된 내용이다. 로그 한 줄의 time별로 구분되어 chunk가 만들어지는 것이다. time의 높은 카디널리티로 인해 문제가 발생한다.
쉽게 말하면, pod 로그 내용 중 time이 찍힌 로그 한 줄 당 chunk 1개가 만들어진다는 의미이다.
이렇게 되면 chunk 수가 감당할 수 없을 정도로 많아지고 이에 따라 memory를 사용하게 되어 저장공간을 낭비하게 되고 무한 oom-kill이 발생하게 된다.
이를 방지하기 위해 opentelemetry-collector의 helm chart에 설정한 값이 아래와 같다.
## otel-values.yaml
config:
  receivers:
    filelog:
...
      operators:
...
        - type: regex_parser
          id: parser-containerd
          regex: '^(?P<time>[^ ^Z]+Z) (?P<stream>stdout|stderr) (?P<logtag>[^ ]*) ?(?P<log>.*)$'
          output: extract_metadata_from_filepath
          timestamp:
            parse_from: attributes.time
            layout: '%Y-%m-%dT%H:%M:%S.%LZ'
...
        - type: remove
          field: attributes.time
...
attributes.time에 로그내용 중 time이 들어가게 되는데 해당 label을 remove 한 것이다.
또는 아래와 같이 설정하면 된다.
## otel-values.yaml
config:
  receivers:
    filelog:
...
      operators:
...
        - type: regex_parser
          id: parser-containerd
          regex: '^(?P<time>[^ ^Z]+Z) (?P<stream>stdout|stderr) (?P<logtag>[^ ]*) ?(?P<log>.*)$'
          output: extract_metadata_from_filepath
          timestamp:
            parse_from: attributes.time
            layout: '%Y-%m-%dT%H:%M:%S.%LZ'
...
  processors:
    attributes:
      actions:
        - action: insert
          key: loki.attribute.labels
          value: log.file.path, log.iostream, logtag, {time} ## time field <-- 제거
...
attributes.actions에서 time이라는 value를 넣지 않음으로써 해결할 수 있다.
위 time처럼 높은 카디널리티 labels이 존재한다면 위 문제를 반드시 고려해야 한다는 점 잊지 말자.
'Observability > Opentelemetry' 카테고리의 다른 글
| Opentelemetry를 사용하여 Prometheus Metrics 수집하기 (1) | 2023.10.11 |
|---|---|
| OpenTelemetry란? (0) | 2023.09.18 |


댓글