Trace란?
Trace는 분산되어 있는 마이크로서비스 시스템에서 발생하는 요청이나 트랜잭션이 여러 구성 요소를 거치면서 이루어지는 일련의 과정이나 경로를 기록한 것을 의미한다. 예를 들어, 웹사이트에서 사용자가 상품을 주문할 때 사용자의 클릭 한 번이 내부적으로는 여러 서비스를 거치면서 요청에 대한 정보가 처리된다. 이 정보들의 전체 집합을 Trace라고 부른다.
Trace를 통해 하나의 요청이 시스템 내부에서 어떻게 처리되는지, 어디에서 지연이 발생하는지, 문제의 원인은 무엇인지 등을 파악하는 데 도움이 된다. 특히, 복잡한 마이크로서비스 환경에서 문제 원인을 찾는 데 유용하다.
Trace를 설정하면 모든 이벤트에 고유한 trace id가 부여된다. trace id는 요청이 시작될 때 생성되고 이벤트마다 동일한 trace id가 적용되어 이벤트의 소요 시간을 추적할 수 있다. 각 이벤트는 span으로 기록되어 표시되는데 span은 trace의 기본 단위로 하나의 이벤트를 의미한다.

기존 분산 Tracing 도구 문제
기존 분산 Tracing 도구는 확장이 어려웠다. 대규모 환경에 맞게 운영하려면 Elasticsearch, Cassandra와 같은 데이터베이스가 필요하였고, 이를 색인화하고 저장하는 데 드는 비용이 상당히 컸다. 또한 계측을 위해 기존 도구를 수동으로 설정하고 구성해야 했기 때문에 복잡하고 번거로웠다.
Grafana Tempo란?
Grafana Tempo는 Grafana Labs에서 개발한 오픈 소스 분산 추적 저장소이다. 이는 마이크로서비스 아키텍처 내에서 서비스 간의 요청 흐름을 추적하고 병목구간을 해결하는 데 사용된다.
Grafana Tempo는 대용량의 추적 데이터를 처리하고 저장할 수 있도록 설계되었다.
데이터를 AWS S3와 같은 object storage에 보관함으로써 비용 효율적으로 데이터를 보관할 수 있고, 카디널리티가 높은 trace-id 필드에서 index를 빌드하고, object storage를 활용해 동시에 여러 데이터 블록을 빠르게 쿼리 할 수 있어 빠른 데이터 검색이 가능하다.
또한 Jaeger, Zipkin, Opentelemetry를 포함한 일반적인 오픈 소스 tracing 프로토콜과 함께 사용할 수 있어 다른 오픈 소스 도구들과 통합하기에 유용하다.
Grafana Tempo의 주요 구성 요소는 아래와 같다.

각 구성 요소들의 역할을 간단하게 설명하면 다음과 같다.
Distributor
- 클라이언트로부터 수신한 tracing 데이터를 해시 후 Ingester에게 전달하는 역할을 담당한다.
Ingester
- Distributor에게 전달받은 데이터를 일괄 처리하고 이를 장기 저장소로 저장하는 역할을 담당한다.
Metrics-generator
- 수집된 trace의 측정항목을 Prometheus remote-write 프로토콜을 사용하여 Prometheus에 메트릭을 작성하여 추가적인 메트릭 view를 제공한다.
Querier
- 요청된 trace id를 ingester 또는 백엔드 스토리지에서 찾아 Query Frontend로 전달한다.
Query Frontend
- 쿼리 요청에 의한처리 속도를 높이기 위해 들어오는 요청의 병렬화를 위해 샤딩하는 역할을 담당한다.
Compactor
- 장기 저장소에서 저장된 블록을 읽어 효율적인 구성을 위해 블록 수를 줄이고 재구성 및 수명주기를 관리한다.
본 글에서는 Opentelemetry collector + Grafana tempo + Grafana 구성을 하여 트레이싱 모니터링 환경 구성 후 간단하게 애플리케이션 호출 간 Tracing을 확인하는 실습을 다룬다.
구성은 아래와 같다.

- Pod에 opentelemetry agent 구성을 통해 trace 데이터를 계측하여 opentelemetry-collector로 보낸다.
- Opentelemetry agent에서 보낸 trace 데이터를 opentelemetry-collector의 receiver로 받아 processors를 거쳐 OTLP Exporter로 설정한 Grafana tempo로 보낸다.
- Grafana Tempo는 opentelemetry-collector에게 받은 trace 데이터를 local filesystem 또는 s3에 보관한다.
- Grafana를 통해 Grafana tempo에 저장되어 있는 trace 데이터를 조회한다.
Tracing 테스트를 위한 sample app은 간단한 Python기반 Flask app이다.
샘플 app의 호출 동작은 아래와 같다.

app-a 서비스를 호출하면 app-a 서비스가 app-b 서비스를 호출하고 , app-b 서비스는 app-c 서비스를 호출하는 구조이다. app-b 서비스가 app-c 서비스를 호출할 때 2초 지연(sleep 2s)을 주어 병목구간을 확인해 볼 것이다.
전제 조건
- [Grafana 구성] 참고
- AWS S3 버킷
- 개인 docker image 저장소
- Helm CLI : v3.8.2
- AWS CLI : 2.13.25
- AWS EKS 클러스터
구성 환경
- AWS EKS : v1.24.17
- Helm CLI : v3.8.2
- AWS CLI : 2.13.25
설치 버전
- Opentelemetry : 0.81.0
- Grafana tempo : 2.2.3
- Grafana : 10.1.4
1. Grafana tempo 구성
Grafana tempo가 AWS S3 버킷의 권한을 얻기 위해 IRSA를 설정한다.
iam policy 생성한다.
$ cat >grafana-tempo-s3-policy.json <<EOF
{
    "Version": "2012-10-17",
    "Statement": [
        {
            "Sid": "TempoStorage",
            "Effect": "Allow",
            "Action": [
                "s3:ListBucket",
                "s3:PutObject",
                "s3:GetObject",
                "s3:DeleteObject"
            ],
            "Resource": [
                "arn:aws:s3:::{S3 버킷 이름}",
                "arn:aws:s3:::{S3 버킷 이름}/*"
            ]
        }
    ]
}
EOF
$ aws iam create-policy --policy-name AWSTempoS3 --policy-document file://grafana-tempo-s3-policy.json
IAM Role을 생성한다.
$ cat >trust-rs-tempo.json <<EOF
{
    "Version": "2012-10-17",
    "Statement": [
        {
            "Effect": "Allow",
            "Principal": {
                "Federated": "arn:aws:iam::{account}:oidc-provider/oidc.eks.ap-northeast-2.amazonaws.com/id/{oidc}"
            },
            "Action": "sts:AssumeRoleWithWebIdentity",
            "Condition": {
                "StringEquals": {
                    "oidc.eks.ap-northeast-2.amazonaws.com/id/{oidc}:sub": "system:serviceaccount:{namespace}:{serviceAccount}",
                    "oidc.eks.ap-northeast-2.amazonaws.com/id/{oidc}:aud": "sts.amazonaws.com"
                }
            }
        }
    ]
}
EOF
$ aws iam create-role --role-name AWS-Tempo-Role --assume-role-policy-document file://trust-rs-tempo.json
위에서 만든 IAM Policy를 IAM Role에 추가한다. 여기서는 AWS Console에서 추가했다.

Grafana tempo 설치를 위한 Helm Chart를 등록한다.
$ helm repo add grafana https://grafana.github.io/helm-charts
$ helm repo update
Helm chart values 파일을 아래와 같이 작성한다. (tempo-values.yaml)
## tempo-values.yaml
traces:
  otlp:
    http:
      enabled: true
    grpc:
      enabled: true
tempo:
  structuredConfig:
    ingester:
      lifecycler:
        ring:
          replication_factor: 3
      max_block_bytes: 104857600
      max_block_duration: 10m
      complete_block_timeout: 15m

storage:
  trace:
    backend: s3
    s3:
      region: {region}
      bucket: "{s3 버킷 이름}"
      endpoint:  "s3.{region}.amazonaws.com"
      insecure: true
    search:
      cache_control:
        footer: true
    pool:
      max_workers: 400
      queue_depth: 20000
    wal:
      path: /var/tempo/wal

distributor:
  replicas: 2
  config:
    log_received_spans:
      enabled: true

ingester:
  replicas: 3
  persistence:
    enabled: true
    size: 10Gi

serviceAccount:
  create: true
  name: "tempo"
  annotations:
    "eks.amazonaws.com/role-arn": "arn:aws:iam::{account}:role/AWS-Tempo-Role"
automountServiceAccountToken: true- 아래 링크를 참조하여 각 환경에 맞게 튜닝하여 사용한다.
위에서 생성한 values 파일로 설치한다.
$ helm upgrade -i -n tracing tempo grafana/tempo-distributed -f tempo-values.yaml --create-namespace
Tempo ingester 로그를 통해 정상적으로 구동되었는지 확인한다.
$ kubectl logs -n tracing sts/tempo-ingester
...
level=info ts=2023-11-08T06:39:53.168159373Z caller=memberlist_client.go:595 msg="joining memberlist cluster succeeded" reached_nodes=3 elapsed_time=19.472555ms
...
2. Opentelemetry 구성
Opentelemetry Helm chart를 등록한다.
$ helm repo add open-telemetry https://open-telemetry.github.io/opentelemetry-helm-charts
$ helm repo update
Opentelemetry Helm chart values 파일을 작성한다. (otel.yaml)
## otel.yaml
mode: daemonset

clusterRole:
  create: true
  rules:
  - apiGroups:
    - ""
    resources:
    - pods
    - namespaces
    - nodes
    - nodes/proxy
    - services
    - endpoints
    verbs:
    - get
    - watch
    - list
  - apiGroups:
    - extensions
    resources:
    - ingresses
    verbs:
    - get
    - list
    - watch
  - nonResourceURLs:
    - /metrics
    verbs:
    - get
config:
  receivers:
    otlp:
      protocols:
        grpc:
          endpoint: 0.0.0.0:4317
        http:
          endpoint: 0.0.0.0:4318
  extensions:
    health_check: {}
    memory_ballast: {}
  processors:
    memory_limiter:
      check_interval: 1s
      limit_percentage: 75
      spike_limit_percentage: 15
    batch:
      send_batch_size: 10000
      timeout: 10s
  exporters:
    otlp:
      endpoint: "http://tempo-distributor-discovery.tracing:4317"
      tls:
        insecure: true
  service:
    extensions:
    - health_check
    - memory_ballast
    pipelines:
      traces:
        exporters:
        - otlp
        processors:
        - memory_limiter
        - batch
        receivers:
        - otlp
ports:
  otlp:
    enabled: true
    containerPort: 4317
    servicePort: 4317
    hostPort: 4317
    protocol: TCP
    appProtocol: grpc
  otlp-http:
    enabled: true
    containerPort: 4318
    servicePort: 4318
    hostPort: 4318
    protocol: TCP
위에서 생성한 otel.yaml파일로 설치한다.
$ helm upgrade -i opentelemetry open-telemetry/opentelemetry-collector -n opentelemetry -f otel.yaml --create-namespace
3. 샘플 애플리케이션 배포
3개의 샘플 애플리케이션 생성을 위해 각각의 python 코드를 작성한다.
여기서는 수동/자동/프로그래밍 중 프로그래밍 방식 계측을 사용했다. (https://opentelemetry.io/docs/instrumentation/python/automatic/example/#execute-the-programmatically-instrumented-server)
## app-a
from flask import Flask, jsonify
import requests
import os

app = Flask(__name__)

SERVICE_B_HOST = os.environ.get('SERVICE_B_HOST', 'service_b')
SERVICE_B_PORT = os.environ.get('SERVICE_B_PORT', '5001')

@app.route('/')
def call_app_b():
    url = f'http://{SERVICE_B_HOST}:{SERVICE_B_PORT}/'
    message = "I'm app-a"
    try:
        response = requests.get(url, timeout=3)
        response.raise_for_status()
        message += " " + response.text
    except Exception as e:
        print(f"Error while calling Service B: {e}")
        message += " Error calling Service B"
    return message

if __name__ == '__main__':
    PORT = os.environ.get('PORT', '5000')
    app.run(host='0.0.0.0', port=int(PORT))

## app-b
from flask import Flask, jsonify
import requests
import os
from opentelemetry.instrumentation.flask import FlaskInstrumentor

app = Flask(__name__)
FlaskInstrumentor().instrument_app(app)

SERVICE_C_HOST = os.environ.get('SERVICE_C_HOST', 'service_c')
SERVICE_C_PORT = os.environ.get('SERVICE_C_PORT', '5002')

@app.route('/')
def call_app_c():
    time.sleep(2)
    url = f'http://{SERVICE_C_HOST}:{SERVICE_C_PORT}/'
    message = "I'm app-b"
    try:
        response = requests.get(url, timeout=3)
        response.raise_for_status()
        message += " " + response.text
    except Exception as e:
        print(f"Error while calling Service C: {e}")
        message += " Error calling Service C"
    return message

if __name__ == '__main__':
    PORT = os.environ.get('PORT', '5001')
    app.run(host='0.0.0.0', port=int(PORT))

## app-c
from flask import Flask, jsonify
import os
from opentelemetry.instrumentation.flask import FlaskInstrumentor

app = Flask(__name__)
FlaskInstrumentor().instrument_app(app)

@app.route('/')
def home():
    message = "I'm app-c"
    return message

if __name__ == '__main__':
    PORT = os.environ.get('PORT', '5002')
    app.run(host='0.0.0.0', port=int(PORT))
이미지 생성을 위해 각각의 dockerfile 작성한다.
## dockerfile app-a
FROM python:3.8-slim

WORKDIR /app
COPY . /app

RUN apt-get update && \
    apt-get install -y curl && \
    rm -rf /var/lib/apt/lists/* && \
    pip install Flask requests
RUN pip install opentelemetry-distro opentelemetry-exporter-otlp opentelemetry-api opentelemetry-sdk
RUN opentelemetry-bootstrap -a install

CMD ["opentelemetry-instrument", "python", "app_a.py"]

## dockerfile app-b
FROM python:3.8-slim
WORKDIR /app
COPY . /app
RUN apt-get update && \
    apt-get install -y curl && \
    rm -rf /var/lib/apt/lists/* && \
    pip install Flask requests
RUN pip install opentelemetry-distro opentelemetry-exporter-otlp opentelemetry-api opentelemetry-sdk opentelemetry-instrumentation-flask
RUN opentelemetry-bootstrap -a install
CMD ["opentelemetry-instrument", "python", "app_b.py"]

## dockerfile app-c
FROM python:3.8-slim
WORKDIR /app
COPY . /app
RUN apt-get update && \
    apt-get install -y curl && \
    rm -rf /var/lib/apt/lists/* && \
    pip install Flask requests
RUN pip install opentelemetry-distro opentelemetry-exporter-otlp opentelemetry-api opentelemetry-sdk opentelemetry-instrumentation-flask
RUN opentelemetry-bootstrap -a install

CMD ["opentelemetry-instrument", "python", "app_c.py"]
위 dockefile로 이미지 build, push 진행한다.
$ docker login {개인 도커 이미지 저장소}
$ docker build -t {개인 도커 이미지 저장소}:{tag} .
$ docker push {개인 도커 이미지 저장소}:{tag}
샘플 애플리케이션의 deployment yaml파일을 각각 작성 후 배포한다.
## app-a
apiVersion: v1
kind: Service
metadata:
  name: app-a
spec:
  selector:
    app: app-a
  ports:
  - protocol: TCP
    port: 80
    targetPort: 5000
    name: http
---
apiVersion: apps/v1
kind: Deployment
metadata:
  name: app-a
spec:
  replicas: 1
  selector:
    matchLabels:
      app: app-a
  template:
    metadata:
      labels:
        app: app-a
    spec:
      containers:
      - name: app-a
        image: {개인 도커 이미지 저장소}:{tag}
        command: ["/bin/sh"]
        args:
        - "-c"
        - |
          OTEL_EXPORTER_OTLP_TRACES_ENDPOINT=http://${HOST_IP}:4318/v1/traces opentelemetry-instrument python app_a.py
        ports:
        - containerPort: 5000
          name: http
        env:
        - name: HOST_IP
          valueFrom:
            fieldRef:
              fieldPath: status.hostIP
        - name: SERVICE_B_HOST
          value: "app-b"
        - name: SERVICE_B_PORT
          value: "80"
        - name: PORT
          value: "5000"
        - name: OTEL_SERVICE_NAME
          value: "app-a"
        - name: OTEL_TRACES_EXPORTER
          value: "console,otlp"
        - name: OTEL_EXPORTER_OTLP_TRACES_HEADERS
          value: "api-key=key,other-config-value=value"
        - name: OTEL_TRACES_SAMPLER_ARG
          value: "1"
        - name: OTEL_EXPORTER_OTLP_PROTOCOL
          value: "http/protobuf"
        - name: OTEL_METRICS_EXPORTER
          value: "none"

## app-b
apiVersion: v1
kind: Service
metadata:
  name: app-b
spec:
  selector:
    app: app-b
  ports:
  - protocol: TCP
    port: 80
    targetPort: 5001
    name: http
---
apiVersion: apps/v1
kind: Deployment
metadata:
  name: app-b
spec:
  replicas: 1
  selector:
    matchLabels:
      app: app-b
  template:
    metadata:
      labels:
        app: app-b
    spec:
      containers:
      - name: app-b
        image: {개인 도커 이미지 저장소}:{tag}
        command: ["/bin/sh"]
        args:
        - "-c"
        - |
          OTEL_EXPORTER_OTLP_TRACES_ENDPOINT=http://${HOST_IP}:4318/v1/traces opentelemetry-instrument python app_b.py
        ports:
        - containerPort: 5001
          name: http
        env:
        - name: HOST_IP
          valueFrom:
            fieldRef:
              fieldPath: status.hostIP
        - name: PORT
          value: "5001"
        - name: SERVICE_C_HOST
          value: "app-c"
        - name: SERVICE_C_PORT
          value: "80"
        - name: OTEL_SERVICE_NAME
          value: "app-b"
        - name: OTEL_TRACES_SAMPLER_ARG
          value: "100"
        - name: OTEL_TRACES_EXPORTER
          value: "console,otlp"
        - name: OTEL_EXPORTER_OTLP_PROTOCOL
          value: "http/protobuf"
        - name: OTEL_METRICS_EXPORTER
          value: "none"

## app-c
apiVersion: v1
kind: Service
metadata:
  name: app-c
spec:
  selector:
    app: app-c
  ports:
  - protocol: TCP
    port: 80
    targetPort: 5002
    name: http
---
apiVersion: apps/v1
kind: Deployment
metadata:
  name: app-c
spec:
  replicas: 1
  selector:
    matchLabels:
      app: app-c
  template:
    metadata:
      labels:
        app: app-c
    spec:
      containers:
      - name: app-c
        image: {개인 도커 이미지 저장소}:{tag}
        command: ["/bin/sh"]
        args:
        - "-c"
        - |
          OTEL_EXPORTER_OTLP_TRACES_ENDPOINT=http://${HOST_IP}:4318/v1/traces opentelemetry-instrument python app_c.py
        ports:
        - containerPort: 5002
          name: http
        env:
        - name: HOST_IP
          valueFrom:
            fieldRef:
              fieldPath: status.hostIP
        - name: PORT
          value: "5002"
        - name: OTEL_SERVICE_NAME
          value: "app-c"
        - name: OTEL_EXPORTER_OTLP_TRACES_HEADERS
          value: "api-key=key,other-config-value=value"
        - name: OTEL_TRACES_SAMPLER_ARG
          value: "100"
        - name: OTEL_EXPORTER_OTLP_PROTOCOL
          value: "http/protobuf"
        - name: OTEL_METRICS_EXPORTER
          value: "none"
        - name: OTEL_TRACES_EXPORTER
          value: "console,otlp"
3개의 샘플 애플리케이션을 배포한다.
$ kubectl apply -f {app-a.yaml} {app-b.yaml} {app-c.yaml}
$ kubectl get po
NAME                      READY   STATUS    RESTARTS     AGE
app-a-974bb7d99-84m4r     1/1     Running   0            4s
app-b-6f7754bf59-shwqp    1/1     Running   0            5s
app-c-545ccb86c9-vqnz6    1/1     Running   0            5s
4. Tracing 테스트
샘플 애플리케이션 3개 배포가 완료되었으면 애플리케이션을 호출할 nginx pod를 배포한다.
$ kubectl apply -f -<<EOF
apiVersion: apps/v1
kind: Deployment
metadata:
  name: nginx
  labels:
    app: nginx
spec:
  replicas: 1
  selector:
    matchLabels:
      app: nginx
  template:
    metadata:
      labels:
        app: nginx
    spec:
      containers:
      - name: nginx
        image: nginx:latest
        ports:
        - containerPort: 80
          name: http
          protocol: TCP
EOF
nginx pod에 접근해서 app-a 서비스를 호출한다.
$ kubectl exec -it deploy/nginx -- /bin/bash
$ curl app-a
I'm app-a I'm app-b I'm app-c
호출 후 3개의 sample app의 로그를 보면 아래와 같다.
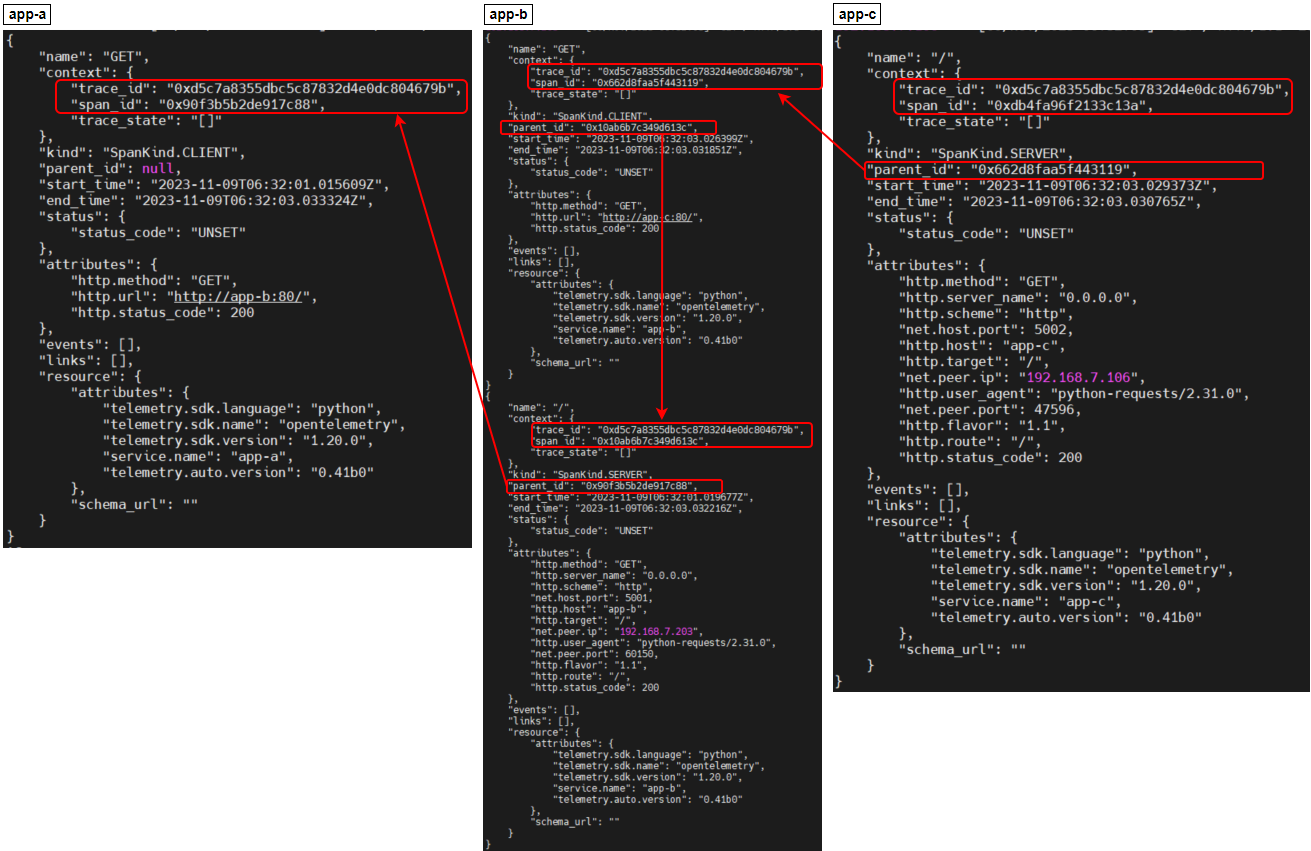
3개의 app이 같은 trace_id를 갖고 있고, 각 span_id와 parent_id의 구조를 갖고 tracing이 되는 걸 확인할 수 있다.
5. Grafana 대시보드 확인
Grafana 대시보드로 들어가 Grafana tempo를 data sources로 등록한다.
- Home > Connections > Data sources > Tempo
- tempo-query-frontend-discovery.tracing:3100 서비스의 k8s dns 주소를 입력한다.


대시보드 panel로 들어가 Trace정보를 확인한다.
- Home > Dashboards > New dashboard
- visualization을 Table로 변경 후 Trace ID를 클릭한다.
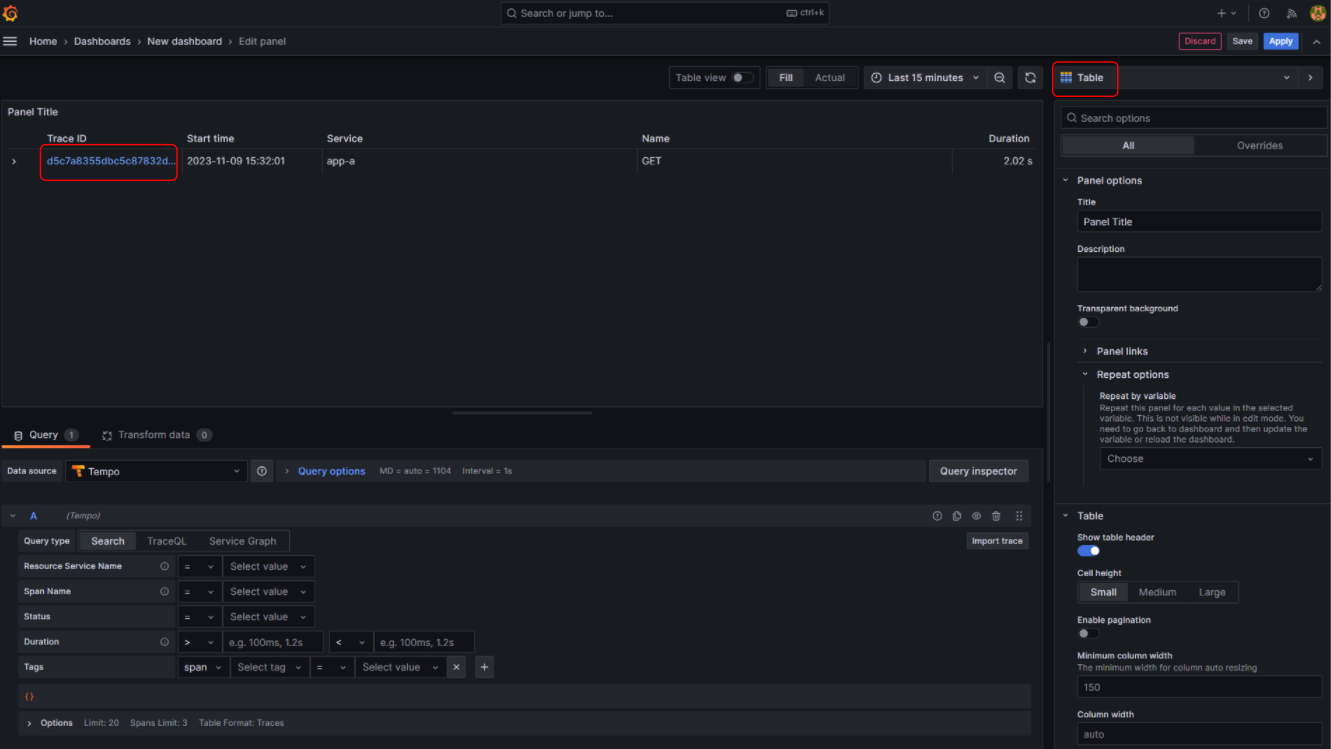
Pod 로그에서 확인한 Trace_id로 아래와 같이 구간 별 걸린 시간을 확인할 수 있다.
app-b에서 "sleep 2"초를 주었기 때문에 app-b에서 2초 이상이 걸린 걸 확인할 수 있다.

추가로 app-c를 kill 하면 app-b에서 app-c를 호출할 때 exception 에러가 발생하는데 해당 에러도 Grafana 대시보드에서 확인할 수 있다.
먼저, Pod 로그를 보면 아래와 같이 events라는 필드의 내용으로 들어간다.
$ kubectl logs deploy/app-b
...
    "attributes": {
        "http.method": "GET",
        "http.url": "http://app-c:80/"
    },
    "events": [
        {
            "name": "exception",
            "timestamp": "2023-11-13T02:39:33.735718Z",
            "attributes": {
                "exception.type": "ConnectionError",
                "exception.message": "HTTPConnectionPool(host='app-c', port=80): Max retries exceeded with url: / (Caused by NameResolutionError(\"<urllib3.connection.HTTPConnection object at 0x7eff2da77790>: Failed to resolve 'app-c' ([Errno -2] Name or service not known)\"))",
                "exception.stacktrace": "Traceback (most recent call last):\n  File \"/usr/local/lib/python3.8/site-packages/urllib3/connection.py\", line 203, in _new_conn\n    sock = connection.create_connection(\n  File \"/usr/local/lib/python3.8/site-packages/urllib3/util/connection.py\", line 60, in create_connection\n    for res in socket.getaddrinfo(host, port, family, socket.SOCK_STREAM):\n  File \"/usr/local/lib/python3.8/socket.py\", line 918, in getaddrinfo\n    for res in _socket.getaddrinfo(host, port, family, type, proto, flags):\nsocket.gaierror: [Errno -2] Name or service not known\n\nThe above exception was the direct cause of the following exception:\n\nTraceback (most recent call last):\n  File \"/usr/local/lib/python3.8/site-packages/urllib3/connectionpool.py\", line 791, in urlopen\n    response = self._make_request(\n  File \"/usr/local/lib/python3.8/site-packages/urllib3/connectionpool.py\", line 497, in _make_request\n    conn.request(\n  File \"/usr/local/lib/python3.8/site-packages/urllib3/connection.py\", line 395, in request\n    self.endheaders()\n  File \"/usr/local/lib/python3.8/http/client.py\", line 1251, in endheaders\n    self._send_output(message_body, encode_chunked=encode_chunked)\n  File \"/usr/local/lib/python3.8/http/client.py\", line 1011, in _send_output\n    self.send(msg)\n  File \"/usr/local/lib/python3.8/http/client.py\", line 951, in send\n    self.connect()\n  File \"/usr/local/lib/python3.8/site-packages/urllib3/connection.py\", line 243, in connect\n    self.sock = self._new_conn()\n  File \"/usr/local/lib/python3.8/site-packages/urllib3/connection.py\", line 210, in _new_conn\n    raise NameResolutionError(self.host, self, e) from e\nurllib3.exceptions.NameResolutionError: <urllib3.connection.HTTPConnection object at 0x7eff2da77790>: Failed to resolve 'app-c' ([Errno -2] Name or service not known)\n\nThe above exception was the direct cause of the following exception:\n\nTraceback (most recent call last):\n  File \"/usr/local/lib/python3.8/site-packages/requests/adapters.py\", line 486, in send\n    resp = conn.urlopen(\n  File \"/usr/local/lib/python3.8/site-packages/opentelemetry/instrumentation/urllib3/__init__.py\", line 218, in instrumented_urlopen\n    return wrapped(*args, **kwargs)\n  File \"/usr/local/lib/python3.8/site-packages/urllib3/connectionpool.py\", line 845, in urlopen\n    retries = retries.increment(\n  File \"/usr/local/lib/python3.8/site-packages/urllib3/util/retry.py\", line 515, in increment\n    raise MaxRetryError(_pool, url, reason) from reason  # type: ignore[arg-type]\nurllib3.exceptions.MaxRetryError: HTTPConnectionPool(host='app-c', port=80): Max retries exceeded with url: / (Caused by NameResolutionError(\"<urllib3.connection.HTTPConnection object at 0x7eff2da77790>: Failed to resolve 'app-c' ([Errno -2] Name or service not known)\"))\n\nDuring handling of the above exception, another exception occurred:\n\nTraceback (most recent call last):\n  File \"/usr/local/lib/python3.8/site-packages/opentelemetry/trace/__init__.py\", line 573, in use_span\n    yield span\n  File \"/usr/local/lib/python3.8/site-packages/opentelemetry/sdk/trace/__init__.py\", line 1045, in start_as_current_span\n    yield span_context\n  File \"/usr/local/lib/python3.8/site-packages/opentelemetry/instrumentation/requests/__init__.py\", line 216, in instrumented_send\n    raise exception.with_traceback(exception.__traceback__)\n  File \"/usr/local/lib/python3.8/site-packages/opentelemetry/instrumentation/requests/__init__.py\", line 180, in instrumented_send\n    result = wrapped_send(self, request, **kwargs)  # *** PROCEED\n  File \"/usr/local/lib/python3.8/site-packages/requests/sessions.py\", line 703, in send\n    r = adapter.send(request, **kwargs)\n  File \"/usr/local/lib/python3.8/site-packages/requests/adapters.py\", line 519, in send\n    raise ConnectionError(e, request=request)\nrequests.exceptions.ConnectionError: HTTPConnectionPool(host='app-c', port=80): Max retries exceeded with url: / (Caused by NameResolutionError(\"<urllib3.connection.HTTPConnection object at 0x7eff2da77790>: Failed to resolve 'app-c' ([Errno -2] Name or service not known)\"))\n",
                "exception.escaped": "False"
            }
        }
    ],
...
Grafana 대시보드에서 확인하면 아래와 같이 확인할 수 있다.

'Observability > Prometheus & Grafana' 카테고리의 다른 글
| [Grafana Mimir]란? 개념부터 설치까지 (2) | 2023.11.17 |
|---|---|
| [Grafana Loki]란? 개념부터 설치까지 (2) | 2023.11.01 |
| [Prometheus] HA 구성 2 (With 샤딩 + Thanos) (3) | 2023.05.10 |
| [Prometheus] 란? (0) | 2023.05.10 |
| [Grafana] + AWS CloudWatch를 이용한 AWS 모니터링 (0) | 2023.05.09 |


댓글